

Problem
Poor streaming quality makes customers more sensitive to price increases, and even the best content can’t compensate for a bad viewing experience. That’s why we help businesses retain and win customers by delivering the best possible video streaming experience.
What is QoEnix?
Big data analytics solution for measuring video streaming quality and experience at the final point of delivery – video player and at scale.
How and what is measured?
- ITU-T P.1203 is the main international standard for evaluating video streaming quality and experience (QoE).
- Video quality components – startup time, video stalling (frequency, duration), video quality (bitrate, codec, resolution, screen size), are combined into a single score – vMOS (video mean opinion score).
- vMOS – a perception score, ranging from 0 to 5, evaluates service quality based on a large number of customer surveys and mapped to technical KPIs.
Key features
01/08
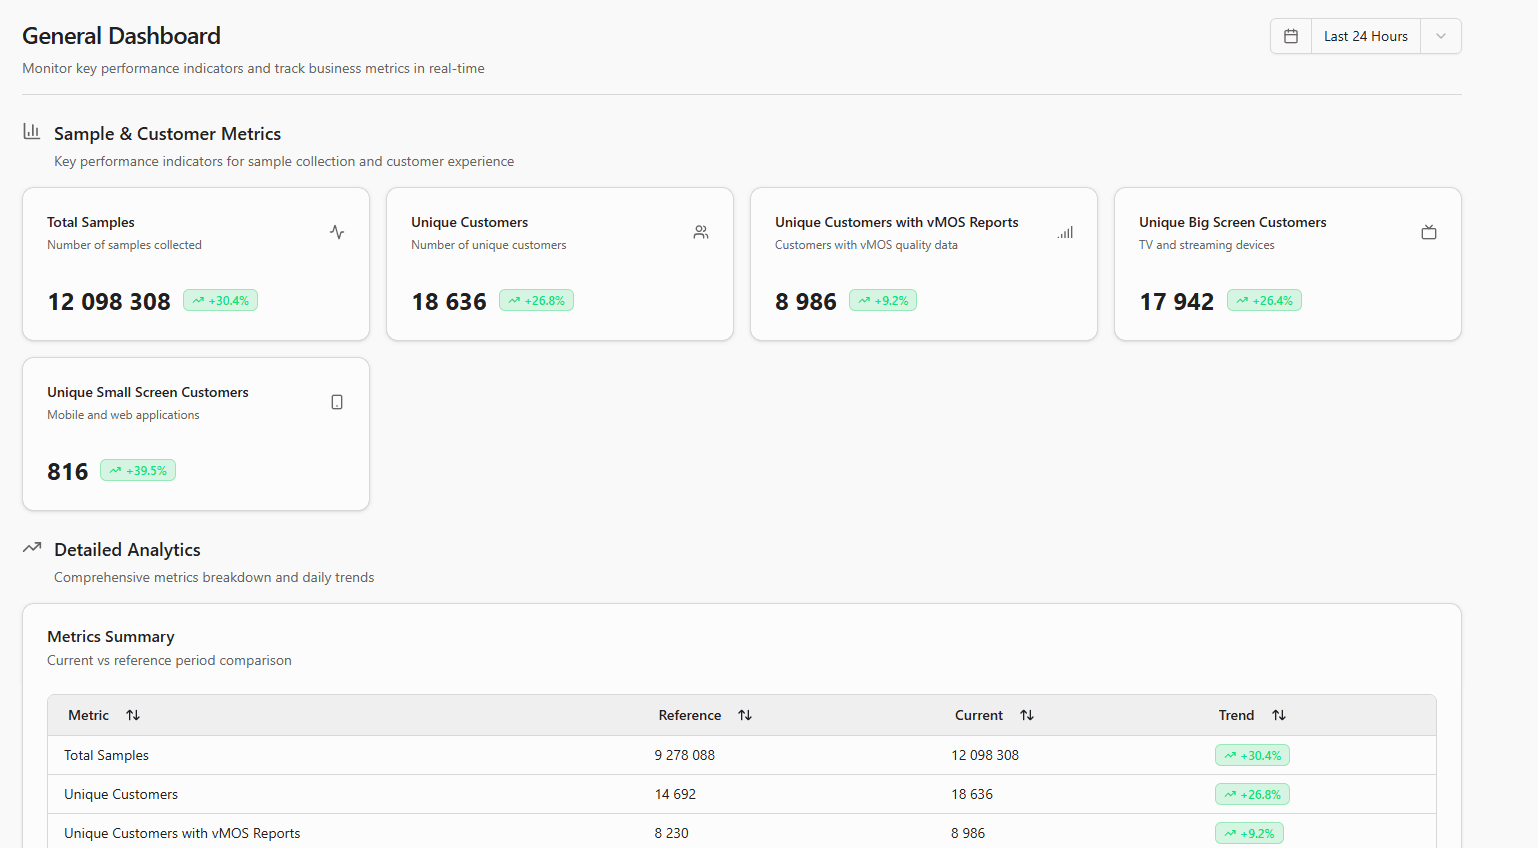
General dashboard (number of customers, screen sizes, number of issues).
02/08
Benchmark dashboard (KPIs of major infrastructure providers, including fixed and mobile networks, to compare the quality of video delivery over their infrastructure).
03/08
Devices (video quality delivery over different device types).
04/08
Live streaming events – most viewed live events quality performance.
05/08
Customers insights (key issues, which impacted bad video streaming quality).
06/08
Engineering insights (key player errors).
07/08
Radio insights (congestion, radio (signal strength, quality), locations that have substantial impact for bad video streaming quality).
08/08
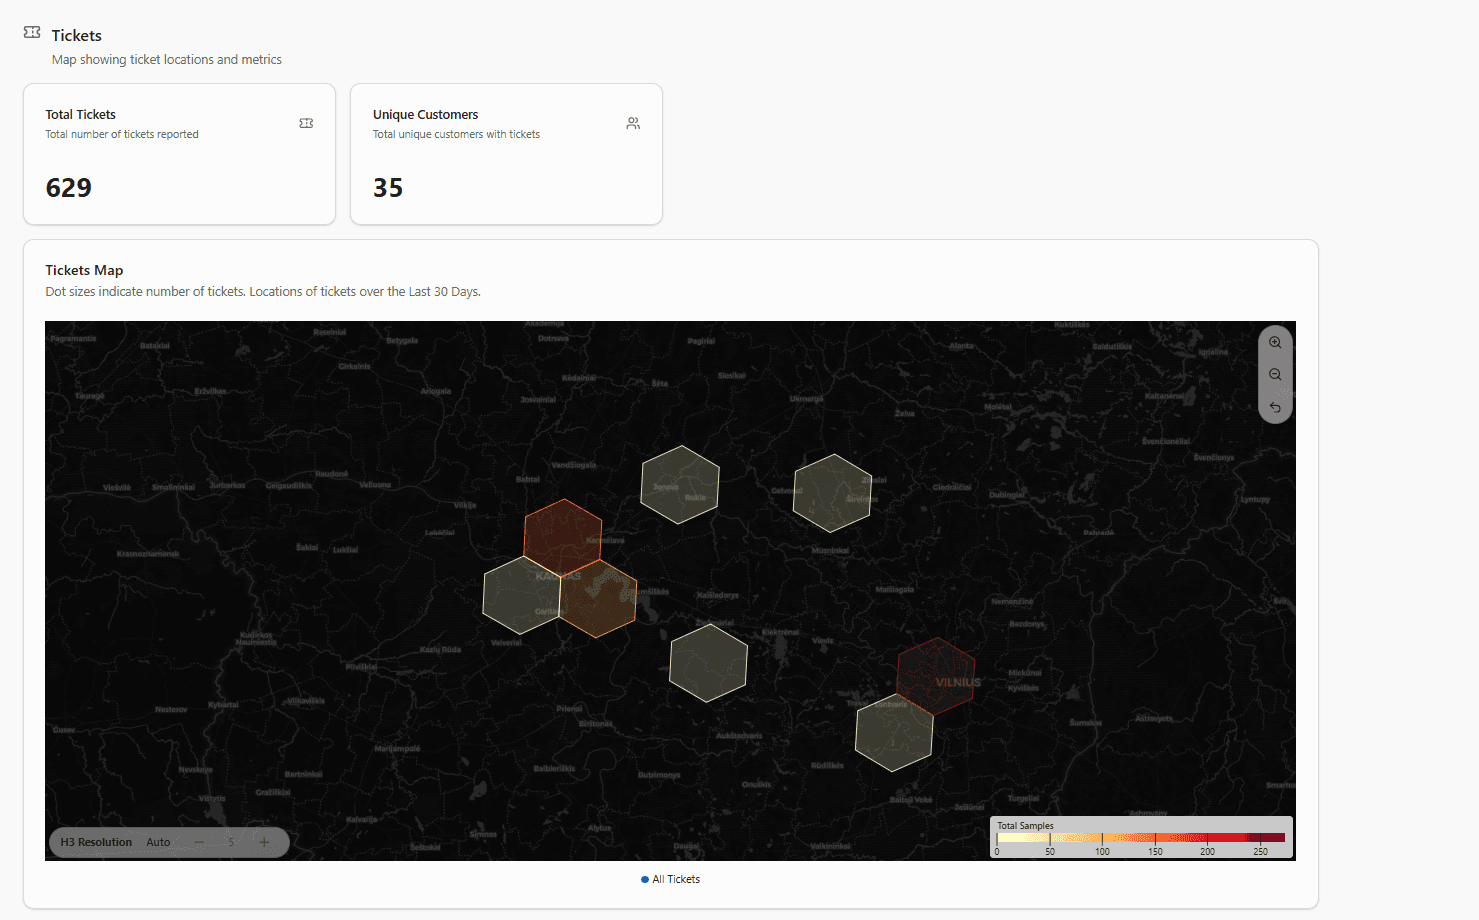
Tickets (customers complains about bad streaming quality).
09/08
- About 130 different parameters are stored.
- Stored in different structures.
- Separate structures (e.g., customer tickets, streaming analytics, player errors, viewing stats, various quality reports).


